Project SalesAchiever Construction CRM

Welcome to Project-SalesAchiever Providing Number 1 CRM for Project Focused Companies

  1-800-915-3597
Project-SalesAchiever CRM logo

Number 1 CRM for Project Focused Companies

PowerBI Now Inside PSA

PowerBI Now Inside PSA

All Data - One Dashboard.

The Market places leading BI tool, Microsoft BI is
now inside Project-SalesAchiever®

PowerBI Now Inside PSA

The Market places leading BI tool, Microsoft BI is now inside Project-SalesAchiever-Enabling your business to realise the full potential of your data. Power BI compliments Project-SalesAchiever and your construction Data to make an unbeatable competitor rich platform for your business. Being visually immersive, and with interactive insights. Power BI lets you easily connect to your data sources, visualize and discover what's important, and share that with anyone or everyone you want.

The construction industry is complex, you need powerful
tools that are simple to use

The nature of the construction industry is complex. Many companies are linked to Project opportunities, contacts, quotes and actions, making sense of it all can be challenging. So now the multi-relational construction CRM, Project-SalesAchiever combined with PowerBI translates this into meaningful actionable information.

PowerBI Now Inside PSA

Drawing from the construction data that is already in your business and mapping relationships between companies through their activities on projects as well as who with and where we should be focusing our efforts to underpin our strategy.

Trusted Partners of Power BI

PowerBI Now Inside PSA

Power BI provides a whole range of reporting visualizations right from simple bar charts to pie charts. To create the visualization you can drag the field names from fields plane and drop them into the report canvas and choose the type of visualization. You can enhance the interactivity further by adding an on-canvas visual filter like a slicer. This allows anyone looking at the data to segment data by a particular value.

PowerBI Now Inside PSA

Gauges and cards can also improve interactivity. For example, you might primarily use the Power BI service to view reports and dashboards. Your number-crunching, business-report-creating coworker might make extensive use of Power BI Desktop or Power BI Report Builder to create reports, then publish those reports to the Power BI service, where you view them. Another coworker, in sales, might mainly use the Power BI phone app to monitor progress on sales quotas, and to drill into new sales lead details.

Marketing - Reducing waste and increasing success rates.

Power BI allows you to co-relate marketing metrics between companies such as architects and end clients to jobs and to contractors, meaning you see the unwritten relationships between companies as well, and it also removes the possibility of having false positives from your data. Power BI helps you to create dashboards on the fly by embedding them into Project-SalesAchiever while connecting with services like Mail-Chimp

PowerBI Now Inside PSA

Improving customer retention

Acquiring a new customer can cost 7 x more than starting a new relationship with a new client. Using Power BI you can understand what motivates existing customers and what they are purchasing, track demand trends, and identify opportunities to cross-sell in construction projects which can be used to tailor a more strategic approach to construction selling.


Reducing reporting administration and increasing sales time

Your business development team likely spends time manually creating and sorting through datasets to get insights, understand performance, and produce sales reports. Power BI inside Project-SalesAchiever CRM can eliminate difficult and time-consuming manual reports. Pipeline reports and sales trends can be generated quickly, leaving your team more time to strategize

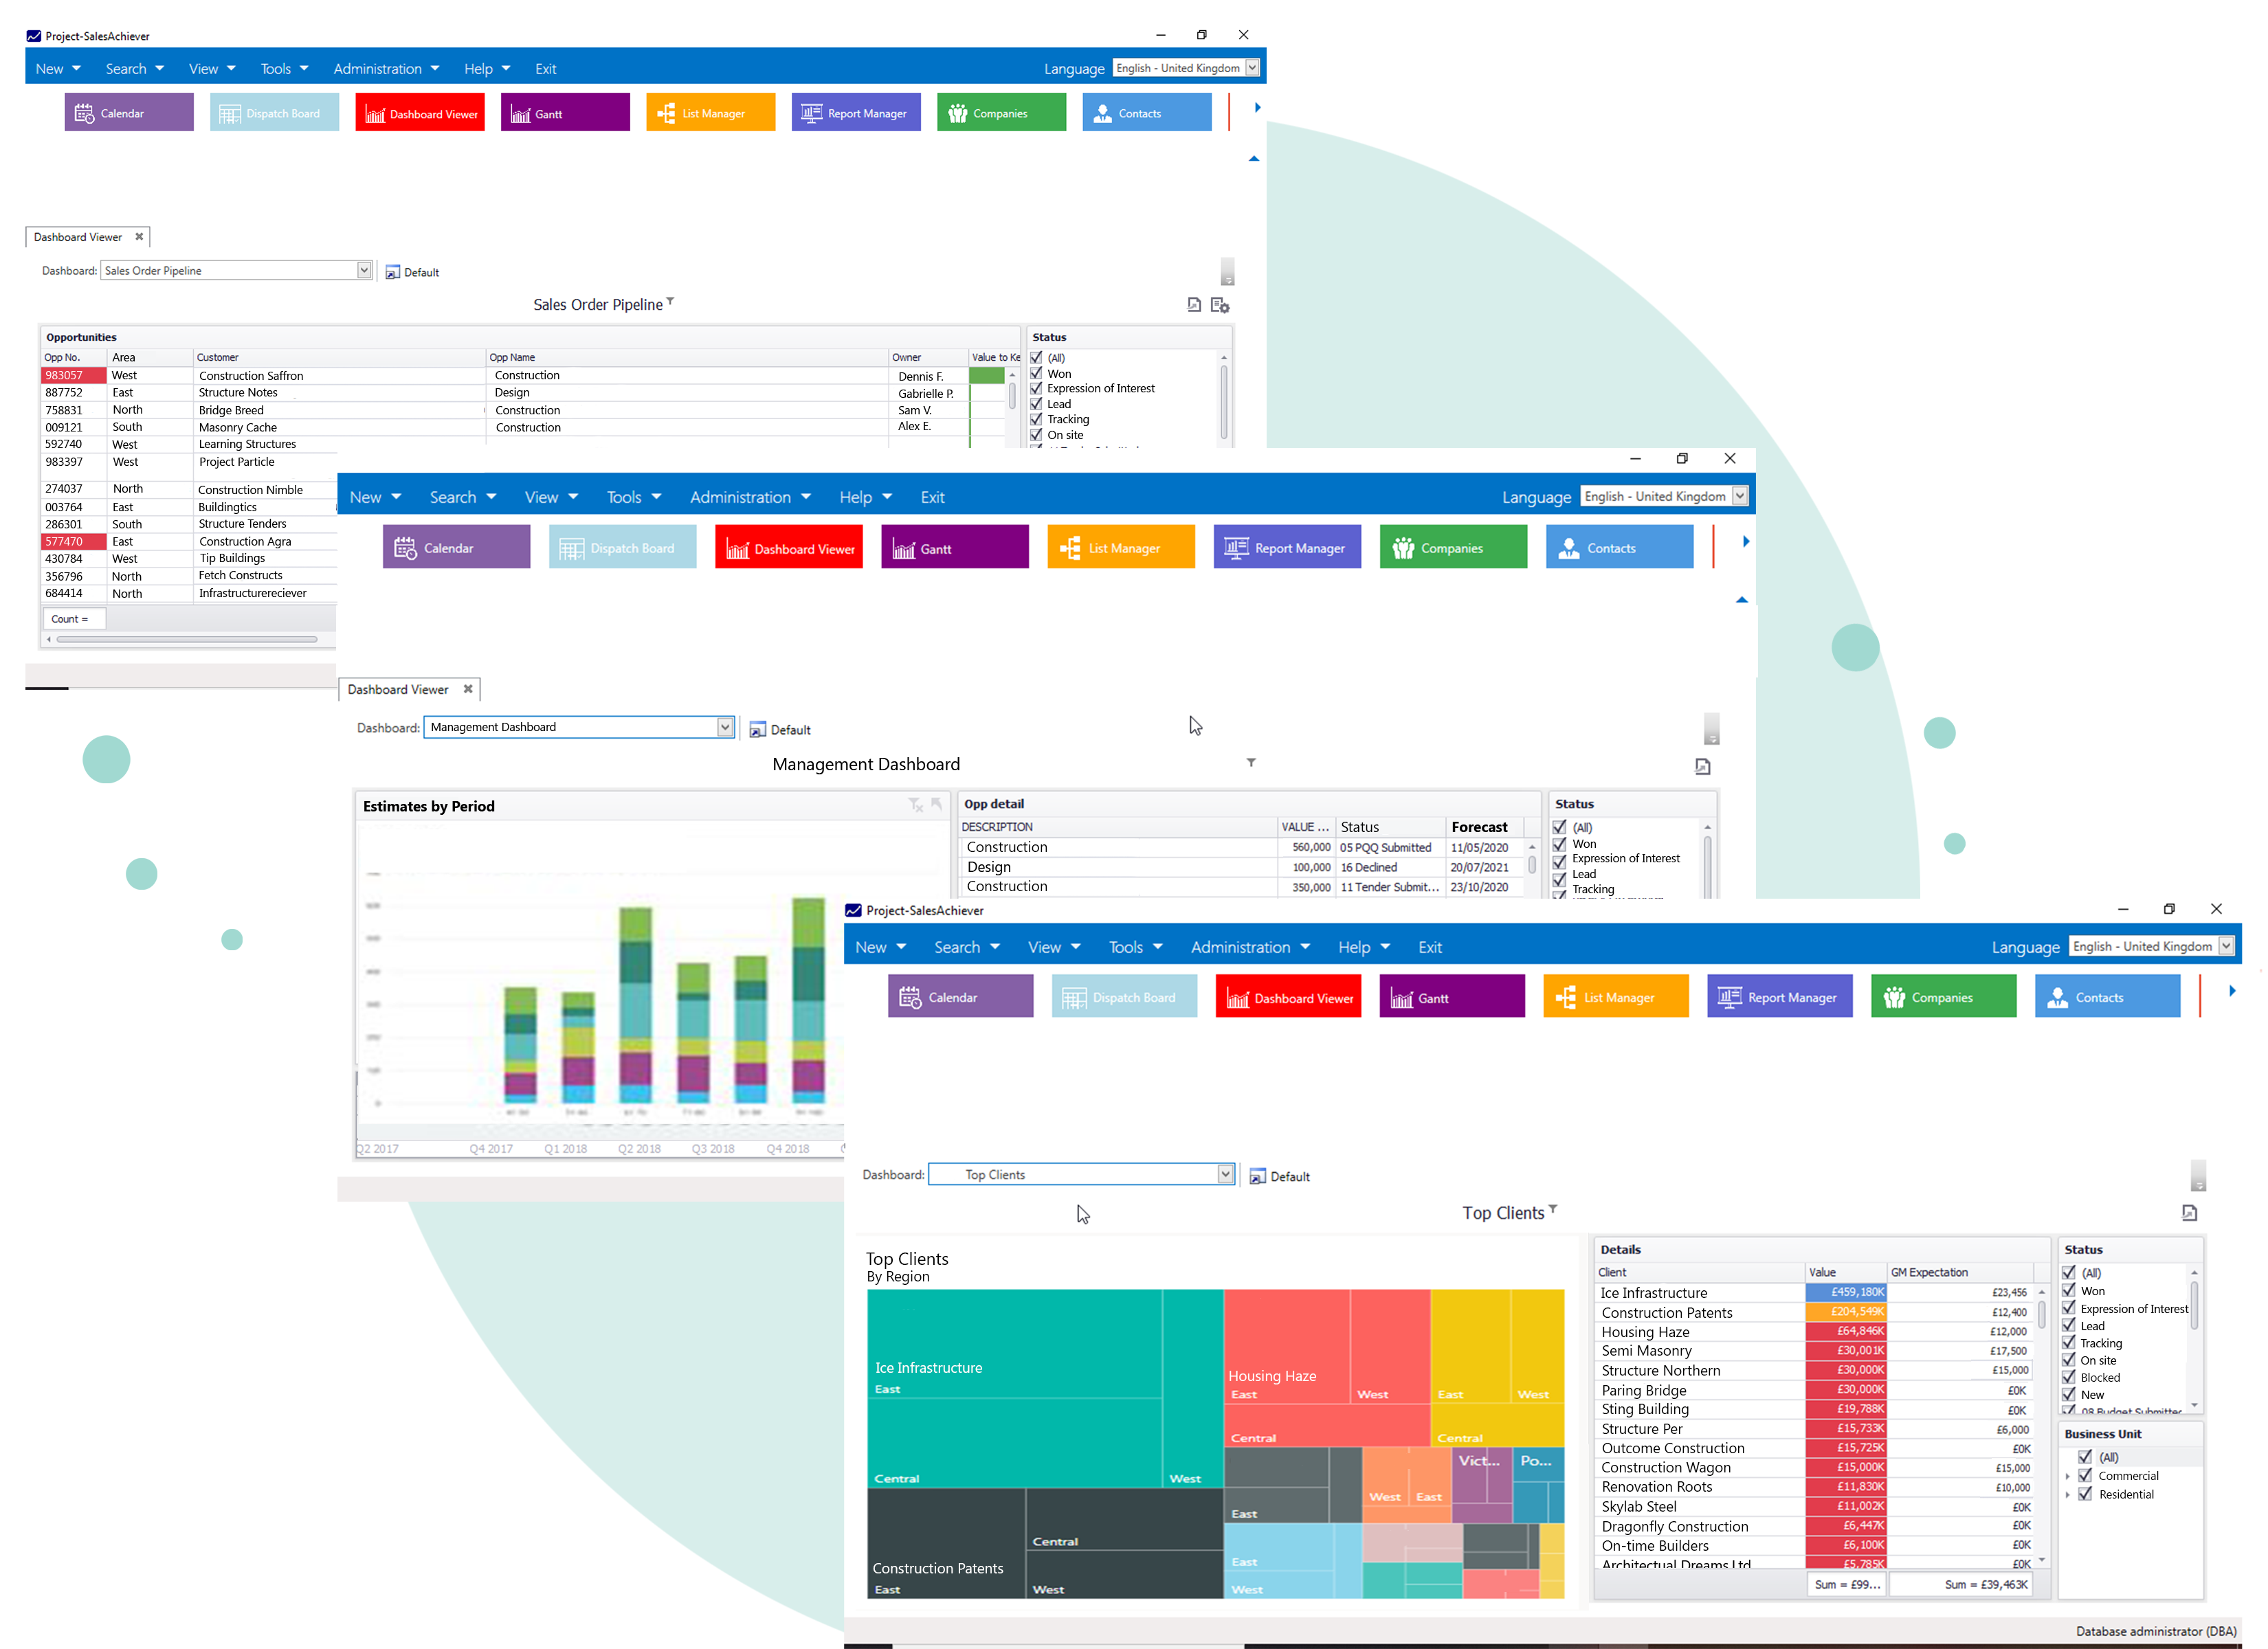
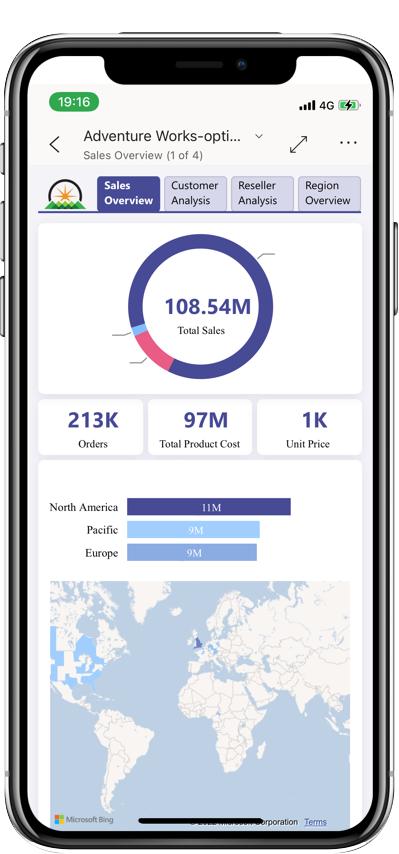
Share sales information easily across departments

With Power BI you can pull data from both Project-SalesAchiever CRM and also other systems such as your invoicing systems so you can merge the key data and easily create dashboards that provide insights into the sales team's performances and if required can be shared across other departments or divisions. Your marketing team will be able to tell which campaigns are driving sales, while the operations team will be able to plan and forecast product demand. Plus, management will be able to make more accurate business decisions based on sales activity.


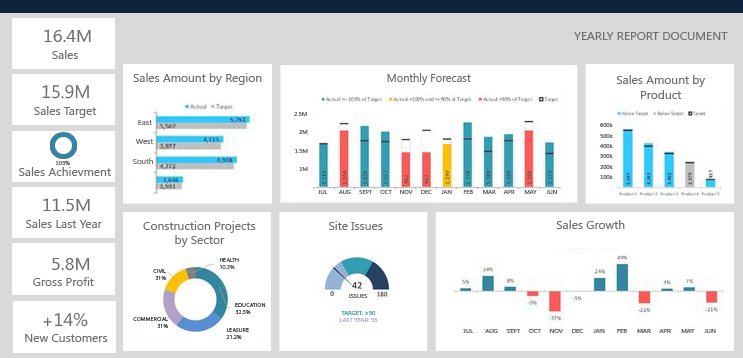
More accurate construction project forecasts

Companies that forecast well have a competitive advantage as it helps your business stay agile. Power BI consolidates all your data in one place and simplifies it, and presents to you the most accurate, up-to-date information that is visualized through powerful reports. Having access to all your historical sales patterns and activity in one place makes it easier to project future revenue and sales accurately. By removing the difficulty of collating historical and current sales activity data in one place, your team can also set more realistic targets. Something that can be challenging if your sales success depends on variables such as month, customer segments, etc.
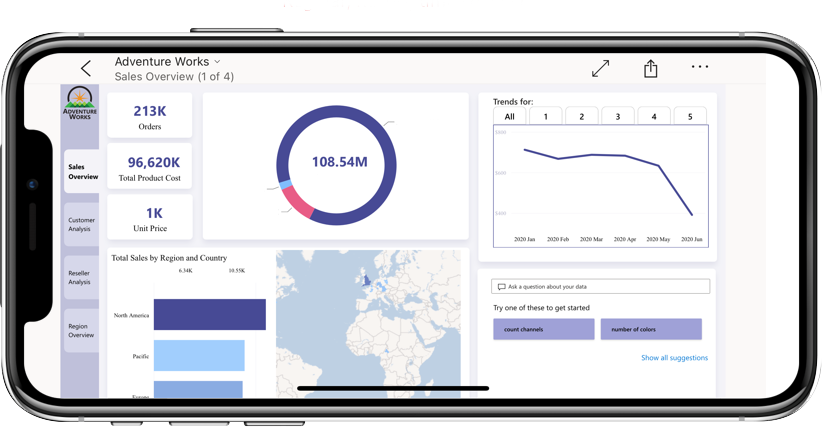
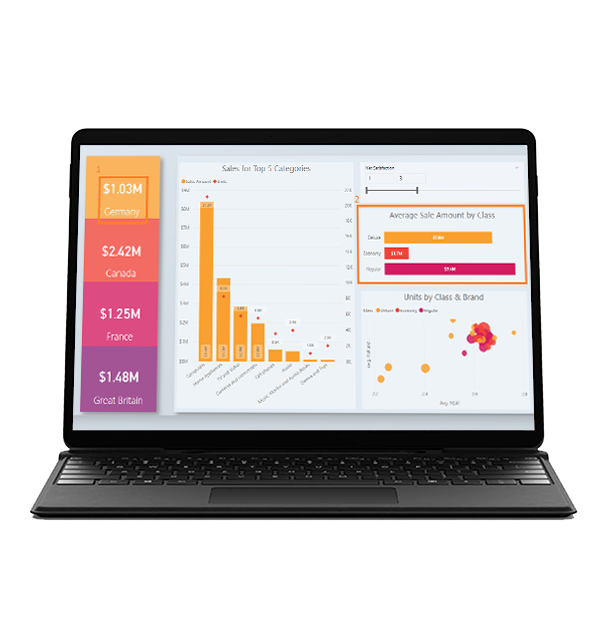

Easily to set up

Business intelligence solutions like Power BI make it easier to track important metrics like win rates, revenue, discounts, and YTD revenue maps through interactive dashboards that are easy to set up. The dashboards are refreshed with the latest data automatically, which means you will always have access to the most up-to-date information when you need it. Contact Us

PowerBI Now Inside PSA

Executive Team

Executive Team Giving strategic data insights that shape the entire organization, from high-level leadership policies to small product decisions

Measure your performance against your business plan

Many executives spend time creating a business plan for their organization to follow. However, that’s just the first piece to success. The second is making sure your company is performing to your plan's expectations. Your Executive Dashboard could do just that. That is, in your dashboard, you can automatically show your goals from your business plan versus your actual, real-time results.

PowerBI Now Inside PSA

"If you can't measure it, you can't improve it."

- Peter Drucker

PowerBI Now Inside PSA

Ongoing Improvements

From a management perspective, the PowerBI tool inside Project-SlaesAchiever will allow you to measure performance throughout your organization and continuously improve


Time Savings

Trying to align the construction industry trends with our current results and capabilities and potential takes huge amounts of time of which many hours are lost simply collating the data that already exists in different parts of the business. Power BI inside PSA will t executive dashboard always shows you the latest results from each report you need. This saves precious hours each month

Visibility

An executive dashboard gives you great visibility and insight. You know exactly what is going on in all aspects of your business. This allows you to lead more effectively.


Employee Performance Improvements

When employees know their performance is being judged in a dashboard and can see their results, they innately start to improve their work.